Invalid Serial Number

Sometimes a user will have difficulty when trying to register a CCRSoftware product. There are a number of different error messages or situations that you may run into. Let’s show you what might be going on.

Different Registration Systems

To start with, there are two different registration systems that are used to register CCRSoftware products, depending on what version of the program you are installing. The serial number for one system won’t work with the other system. Sometimes a user may install a version that doesn’t match the serial number that they have.

For CCRQInvoice versions 3.0.0.1 to 3.5.5 and CCRQBOM versions 3.0.4 to 3.6.0 the serial number will have the format “XXXXX-XXXXX-XXXXX-XXXXX”, 4 groups of 5 letters/numbers. For these versions you will see this kind of registration screen:

For CCRQInvoice versions 3.6.0 to 3.7.0 and CCRQBOM version 4.0.0 the serial number will have the format “STD-XXXXX-XXXXX-XXXX-XXXX”, the letters “STD” followed by 2 groups of 5 letters/numbers, then 2 groups of 4 letters/numbers. For these versions you will see this kind of registration screen:

If you try to use a serial number that doesn’t match the version, you will either get a message along the line of “The serial number provided is invalid”, or you just won’t be able to enter the serial number.

TO RESOLVE THIS you want to download the proper version. Note that if you had a DIFFERENT version than what is listed below, you should contact our support department for compatibility (or upgrade) information.

I Already Have A License

This throws a lot of people off. Our documentation talks about this, briefly, but who reads documentation any more?

If you have a registration screen like this, and you are reinstalling the software, some people decide that they need to click the “I already have a license” link.


Please don’t – that link is misleading, it won’t do what you want. It will ask you for a license file (*.lic), and you won’t have one.

That link is used for a special situation when recovering a license on an existing computer, which won’t be your case (in fact, we’ve never had a user that needed to do this). Just go ahead and enter your name and the serial number in the regular field. If you don’t know your serial number, contact support.

The Serial Number Provided is Invalid

With the standard/public releases, when you enter the serial number, you may see this error:

There are a couple of reasons why you might see this.

Perhaps you have a typo in the serial number? 1968P-XXXXX-XXXXX-X04W3 is not the same as l968P-XXXXX-XXXXX-XO4W3. The numbers 1 and 0 are not the same as the letters l and O.

A common error is that you copy/paste the serial number from a document, or the original email you received, but you add a space to the end. “1968P-XXXXX-XXXXX-X04W3  ” is not the same as “1968P-XXXXX-XXXXX-X04W3” for example – there is an added space at the end of the first one, and the program doesn’t like that. Very common error.

Wrong Software Product

Last but not least, sometimes we have people who try to use a CCRQInvoice serial number with CCRQBOM, or vice-versa. Won’t work!


Exporting a QuickBooks Assembly to Excel

CCRQBOM was not designed for file exports, but you can export a BOM to Excel with a little work.

Here’s my assembly Assembly RWS, printed with CCRQBOM:

First, note that you can export a BOM from QuickBooks by itself. In QuickBooks, select File/Utilities/Export/Lists to IIF Files. Choose the Item List from the export dialog and save the file. This creates an IIF file that has your entire item list, along with the BOM for your assemblies. Here’s what you see if you open that IIF file with Excel. As you can see, there is a lot of extra “junk” in the file.


Let’s see what we can do with CCRQBOM. Select Forms/Bill of Material:

Click Multi Level BOM to select it, and then click Edit.

This opens the Form Designer:

Right-click on the PageHeader band and select Delete to remove it. Do the same for the PageFooter band. Then delete every field in the Detail header band, which is the assembly info (but not the BOM). This leaves you with the basic BOM detail and detail header. You may want to add other fields here, if you wish. The idea is to remove all extraneous information.

Select File/Save As and give this a name, then exit the designer.

To export a single BOM, select BOM from the CCRQBOM menu, select the assembly to export, and click the Display button. In the Display window, click the Print button. In the Print Reports window select your export template, select Print Preview, and then click the Print button. This will display the BOM as a report.

In the Print Preview, click the down-arrow on the green disk icon and select CSV File from the menu.

In the CSV Export Options window I generally leave things at the default settings.

Here’s what you get:

Export QuickBooks Assembly to Excel

Note that this is using the standard version of CCRQBOM, version 3.2.2.0. You can only export one BOM at a time using this version.

We have a “pre release” version of CCRQBOM, version 4.0.0, that is  available via special request (use our contact form to make a request). This version has the ability to print all of the assemblies in one report, which you may prefer.

In this version of CCRQBOM you will create your export report in the same way as above. Then, choose the Assemblies function, click on the Print BOM tab, and select Print All. This will export all of the BOM’s in one file. Note, though, that you will get a header for each assembly. You might want to change the template to add a Page Header band, copy the column headings from the Group Header band, and then delete the Group Header band.

Printing a Costed Bill of Materials

The standard BOM (Bill of Material) report in CCRQBOM does not include any cost values, by design. Many businesses don’t want to show “cost” to employees on the shop floor. However, for management purposes, it can be beneficial to add “cost” to this report. This article will show you how.

Printing a Multiple-Level BOM

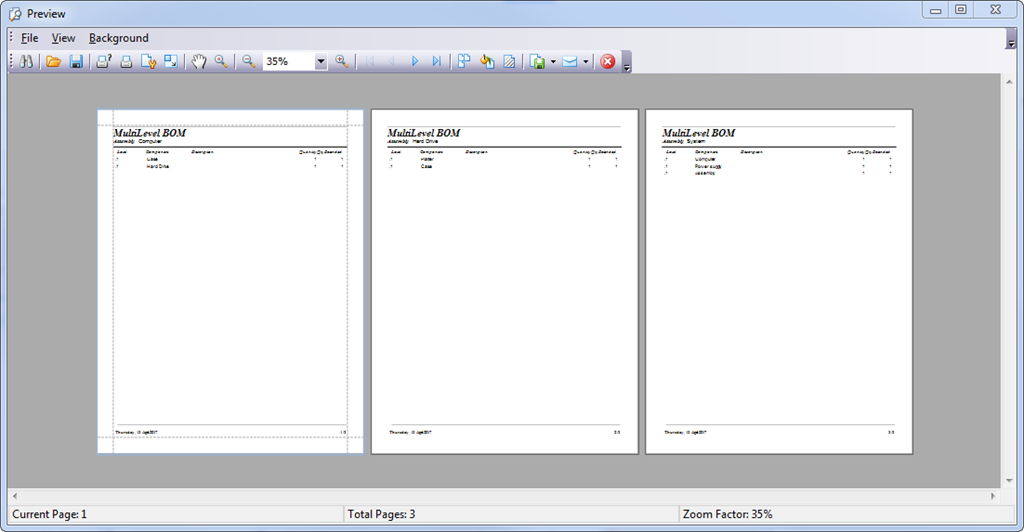
First, let’s show how to print a multiple-level BOM with CCRQBOM.

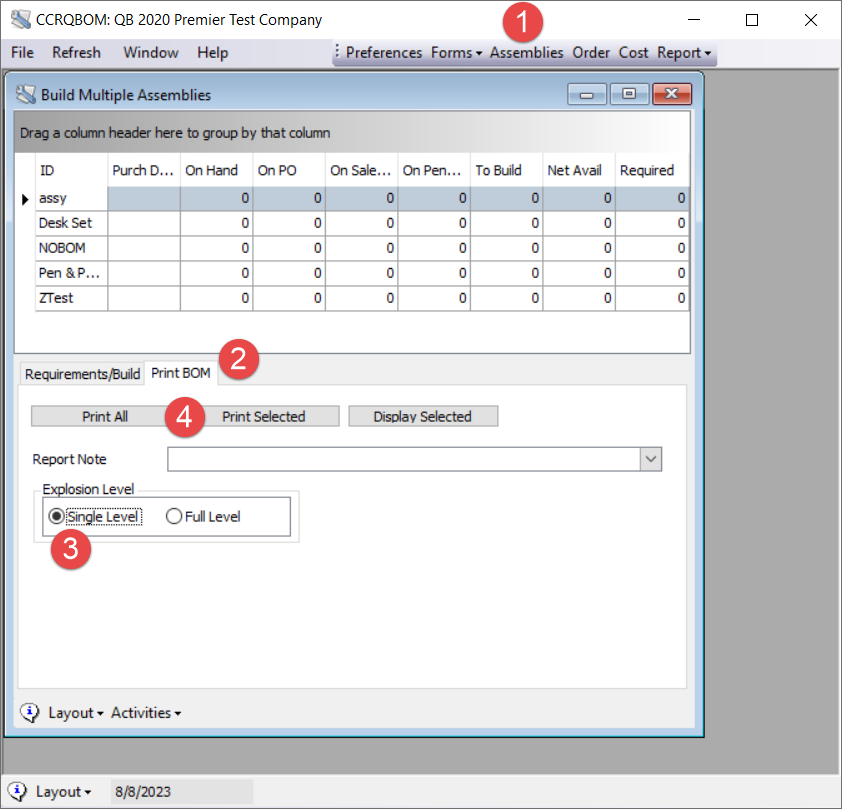
Select BOM from the CCRQBOM menu. This will open a window that lists all of the assembly items in your QuickBooks company file.

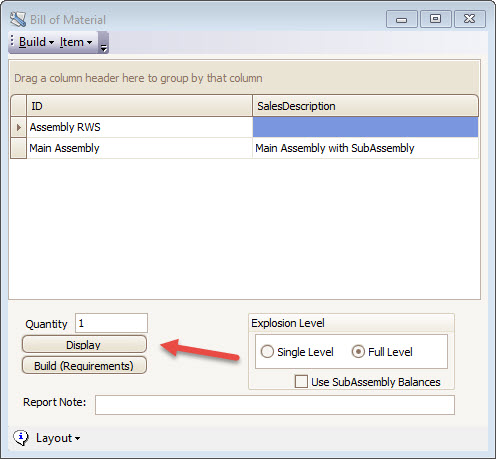
Set the Explosion Level to the desired level. Full Level will print all the details of any subassemblies.

Select the assembly that you want to work with from the list, then click Display to see the BOM. In this example, there is a subassembly, and we have chosen Full Level.

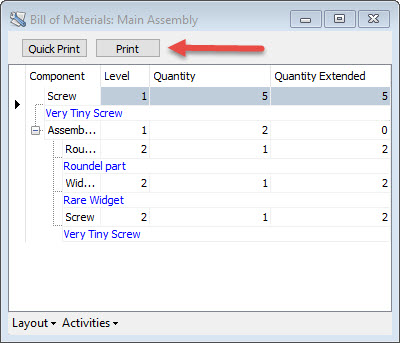
The Quick Print button will print the BOM as you see it on screen. Note that you can add columns to this display by right clicking on the column headers, selecting the column chooser from the menu to get a list of columns, and dragging those columns to drop on the header display. Details on modifying a “grid” like this can be found in the printed documentation.

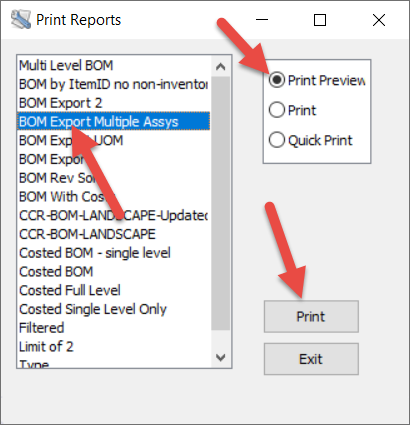
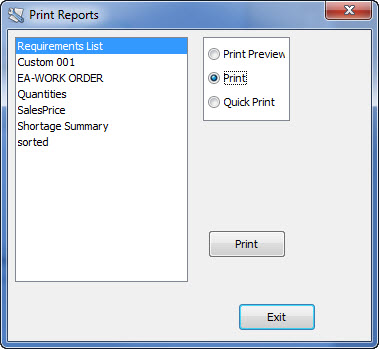
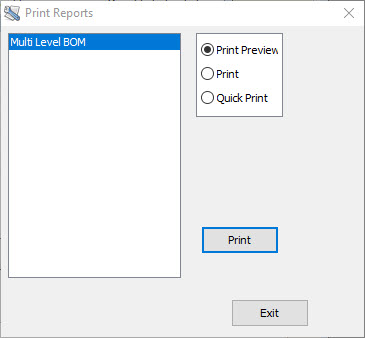
Most people will use the Print button. This opens a Print Reports window that lists any report templates that you have available. Select the template that you want to use (there is only one in this example), then select Print Preview, and then click the Print button.

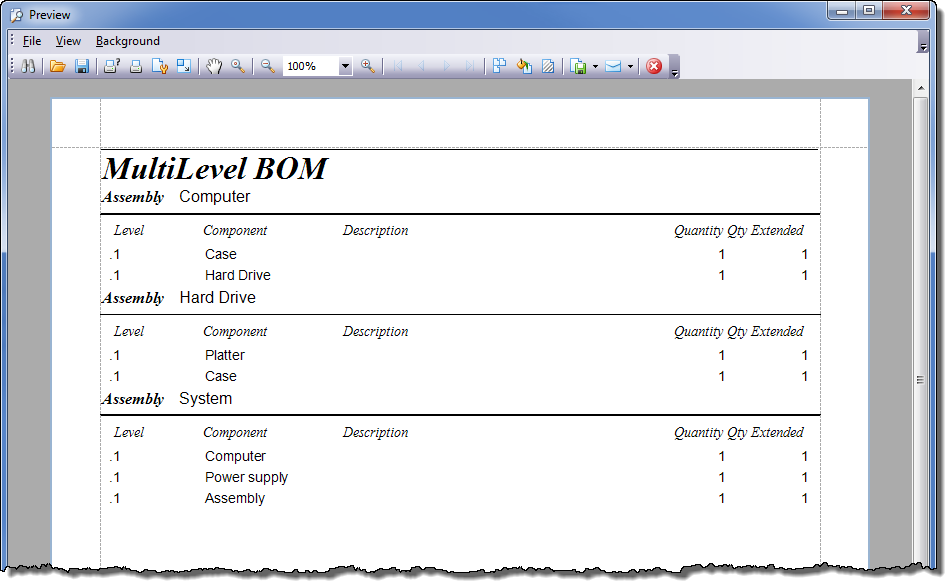
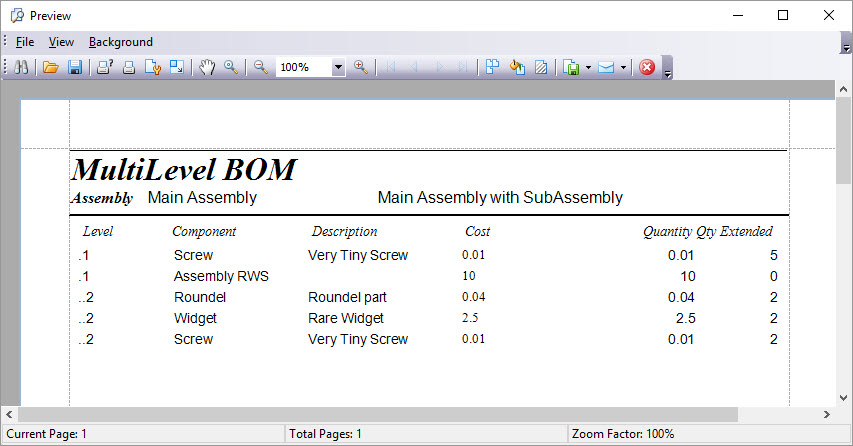
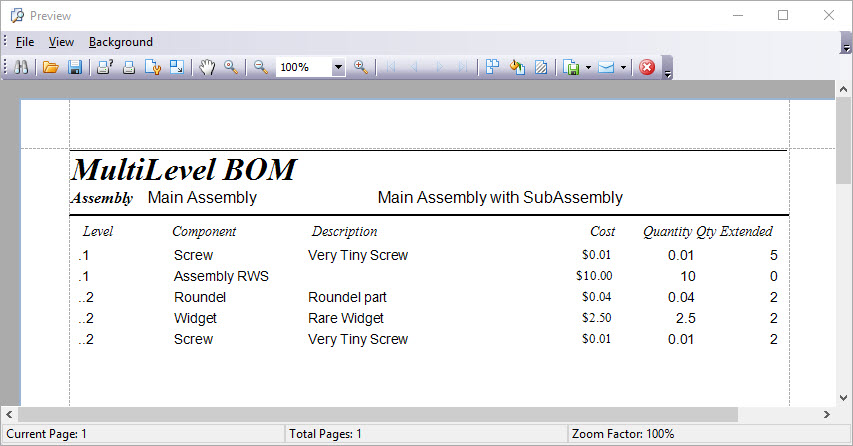
Here’s the standard multi-level BOM report from CCRQBOM, which includes the details of the subassembly.

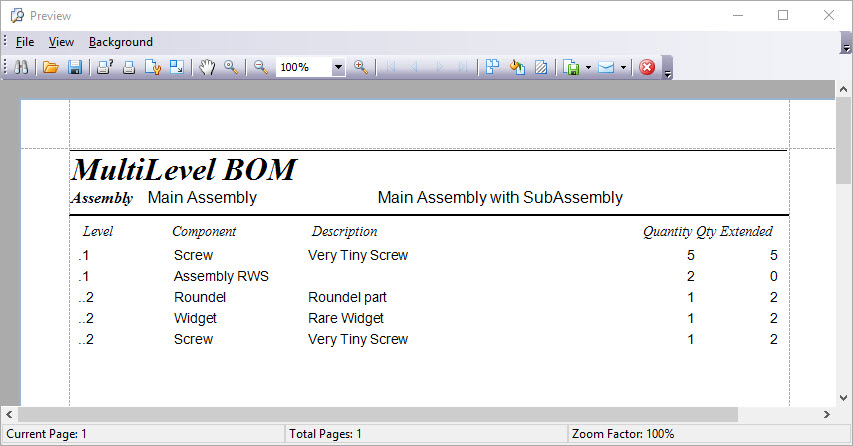
Note that “Assembly RWS” is a subassembly, and that there are two of them used in the higher level assembly “Main Assembly”.

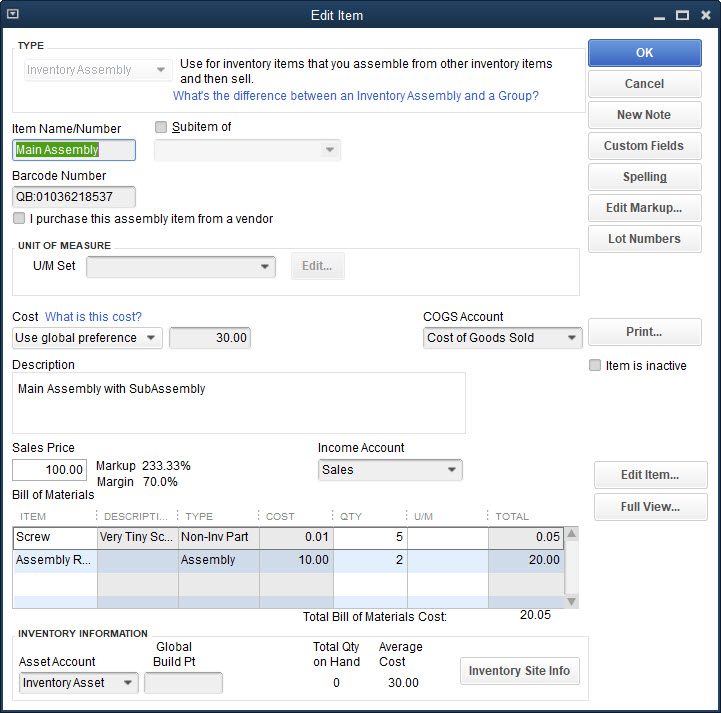
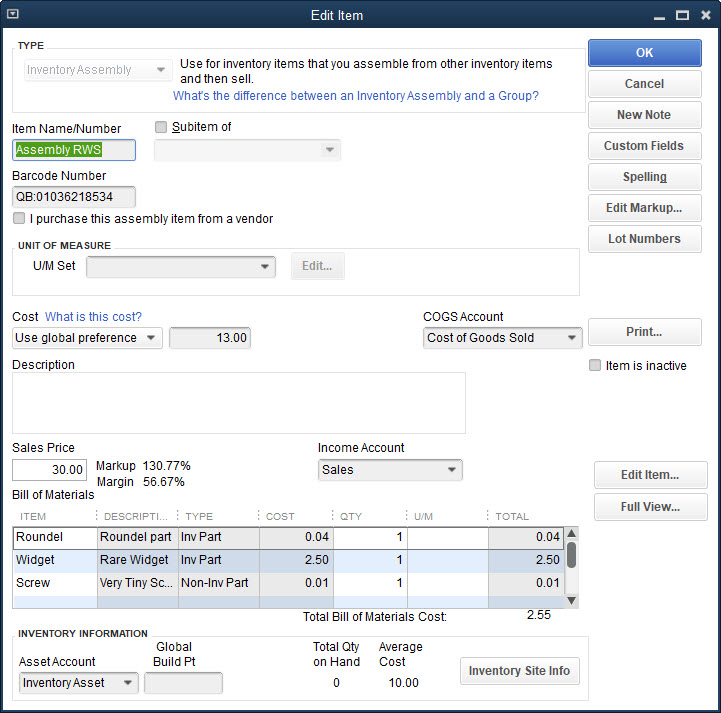
For reference, here are the two assemblies as you see them in QuickBooks.


Cost vs. Average Cost vs. Total Bill of Materials Cost

The problem with adding “cost” to a BOM is, which “cost” are you referring to? There are three “cost” values associated with an assembly item in QuickBooks, Cost, Average Cost and Total Bill of Materials Cost. For a detailed explanation of these, see the article Understanding QuickBooks Total Bill of Material Cost.

If you look at the “Assembly RWS” item in QuickBooks, as shown above, you can see that there are three different “cost” values shown:

  • Cost: This is an editable field, you can enter any value you wish here. Usually this is the last purchased cost, but that is not guaranteed. In this case it is $13.00
  • Average Cost: This is the value maintained by QuickBooks, based on the cost of components at the time the quantity on hand was built. In this case it is $10.00
  • Total Bill of Materials Cost: This is based on the Cost values from the subassemblies. As the article explains, this isn’t always accurate. You can use the Cost function in CCRQBOM to update this value. In this case, the value is $2.55

As you can see, there are three values that can all be different.

The Total Bill of Materials Cost is not a value that is actually stored in QuickBooks.

Most people will want to see the Average Cost for components in a printed BOM. However, there are times when you might want to see the Cost value. Each of these are available in CCRQBOM.

Adding Cost to a BOM Report in CCRQBOM

Details on how to work with the report editor in CCRQBOM can be found in the printed documentation. This article will describe the steps in a summary fashion.

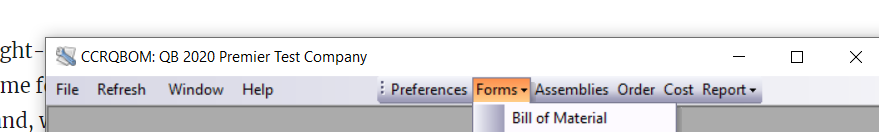
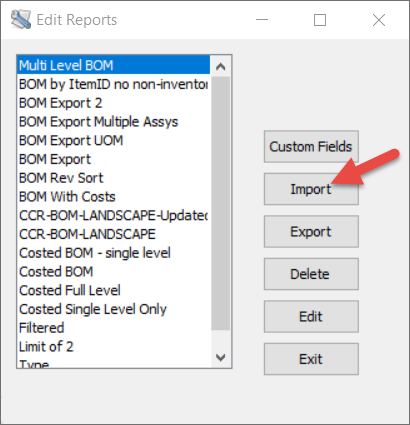
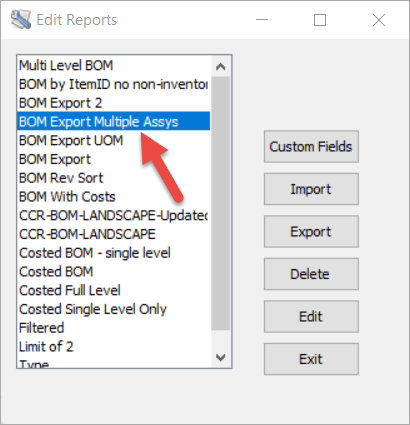
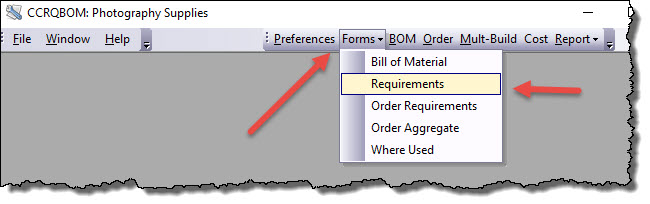
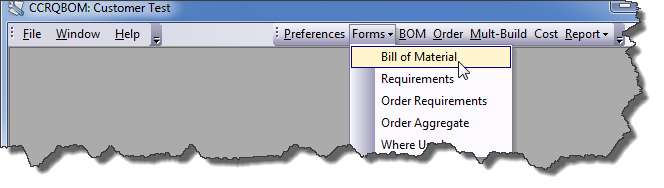
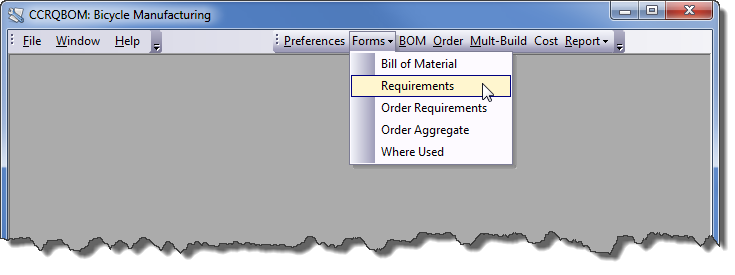
To create a modified BOM report, select Forms in the CCRQBOM menu, then Bill of Material. This opens the Edit Reports window.

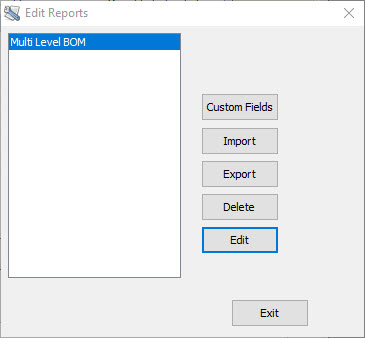
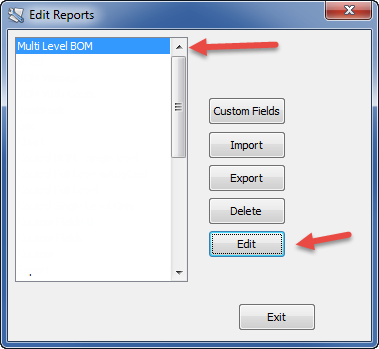
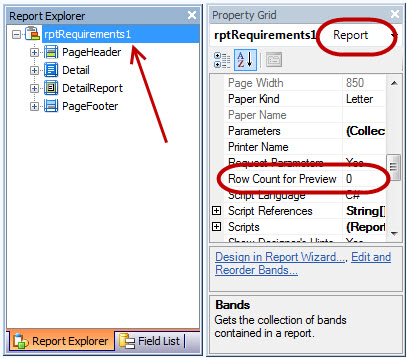
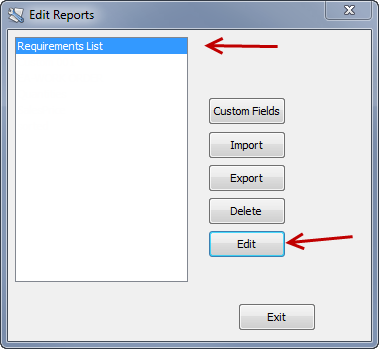
Select the report template you would like to modify (there will only be one the first time you edit a report in CCRQBOM), then click the Edit button. This will open the report editor. Note that the first time that you do this after starting CCRQBOM, there may be a delay while the editor gets ready.

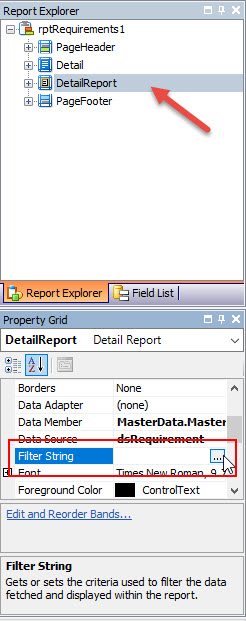
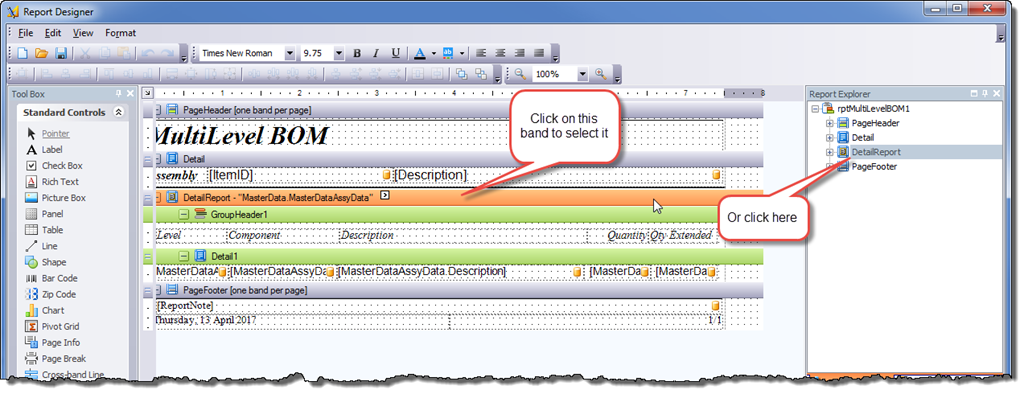
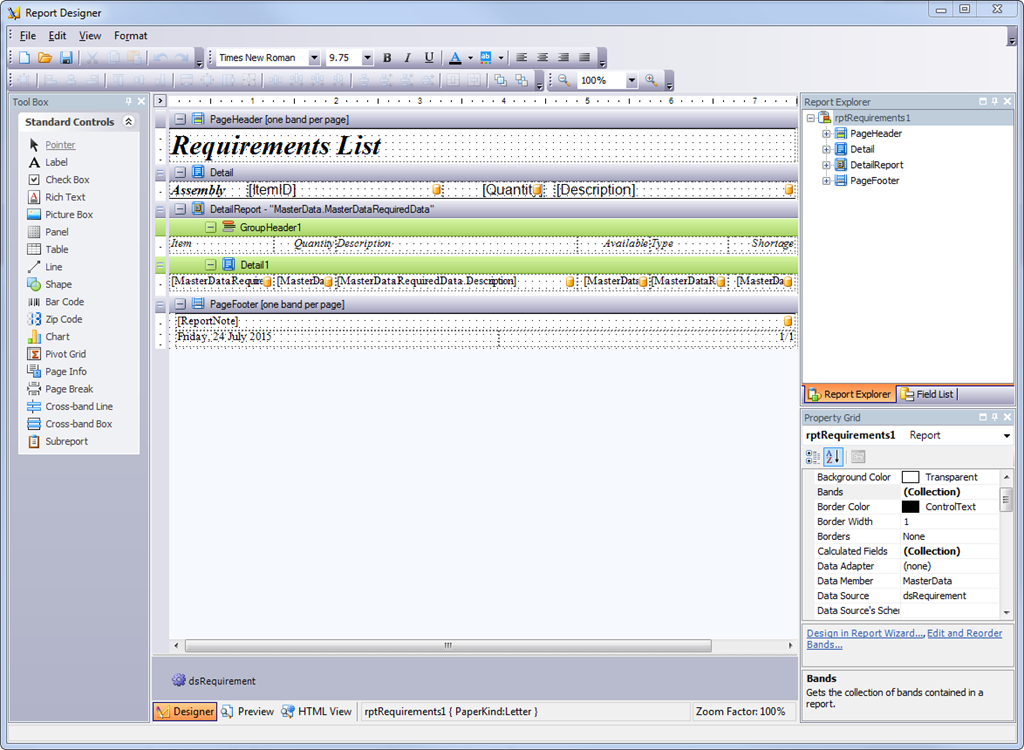
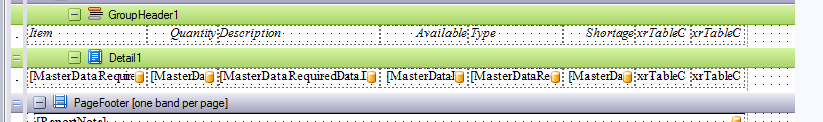
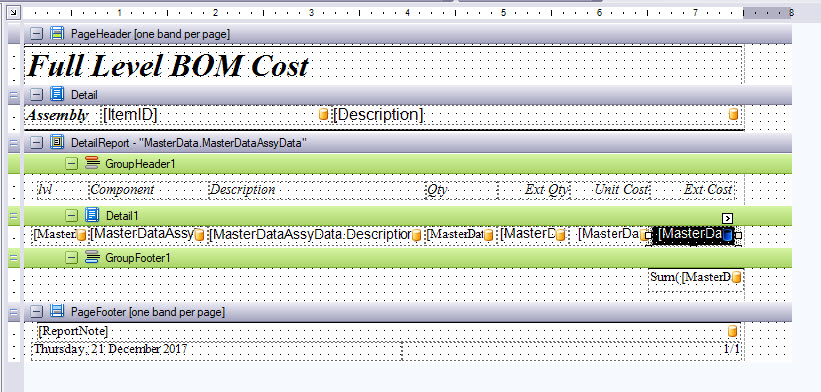
The details of the components are entered in the Detail1 band. Headers for those detail columns are entered in the GroupHeader1 band. Adding a column in the detail section does not automatically add a column header.

We will add the column first. I’ll add it to the right of the Description column.

Click on the data field for the Description column in the Detail1 section, to select it. Right click on the selected field, and in the popup menu select Insert and then Column to Right.

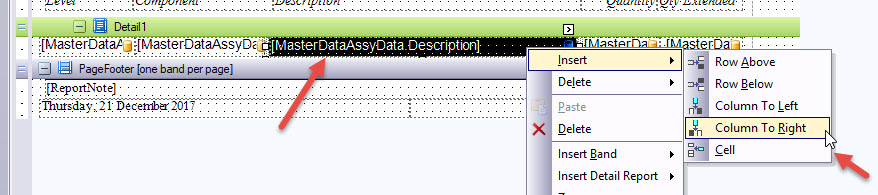
This adds a blank column to the right.

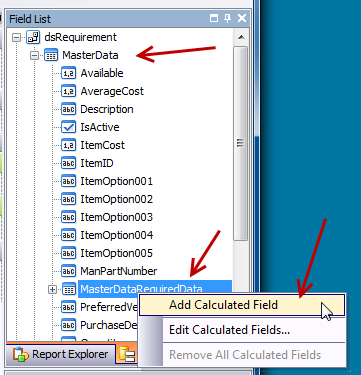
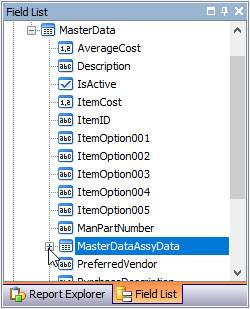
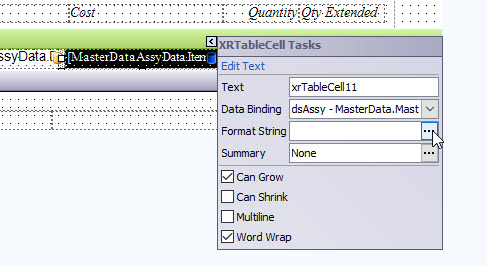
Now, on the right side of the edit window, click on the Field List tab. This will list all of the available fields. Select the MasterDataAssyData item, which is where the fields for the detail lines will be found. This is found within the MasterData section. It is very important that you use fields in this section for detail lines. Click the + symbol to expand the list of fields.

Within MasterDataAssyData you will find two fields. Use the one that represents the cost that you want to use. AverageCost is the average cost of the item. ItemCost is the “cost” field of the item.

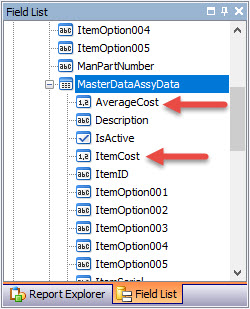
Click on the name of the field you want to use, and drag the name over to the report, dropping it on that blank column you added.

Next, insert a blank column in the GroupHeader1 band, to the right of the Description column heading. Double click on the field to select the default text that shows there, and type in the name you want to use for this column, such as “Cost”.

Select File from the main menu, then Save As, and give the report a unique name. Click OK to save the name. Then select File and Exit to close the editor. You will see your new report in the Edit Reports menu.

When you print a BOM you can choose your new report template.

A couple of notes:

  • If you have non-inventory items as components, they will always have an average cost of zero.
  • If you have non-inventory items as components, they will have a cost of zero unless you check the box “This item is used in assemblies or is purchased for a specific customer:job” in the Edit Item window in QuickBooks, and enter a “cost” there.

Formatting the Cost Field

In my example I did not “format” the cost field, so the numbers don’t have the same number of digits after the decimal, and so forth. This doesn’t look good.

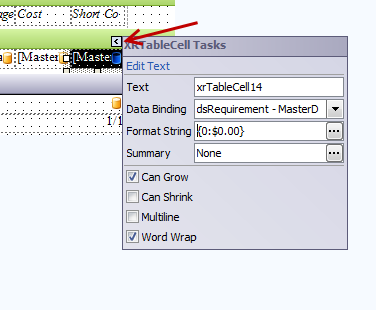
Editing the report, select the new “cost” column, and then click the “>” symbol that shows at the upper right. This opens a “properties” window.

In the Format String property, click the ellipsis (…) to open the editor. There are a number of options you can choose here (more details in the printed documentation). I’ll pick “Currency” in this case.

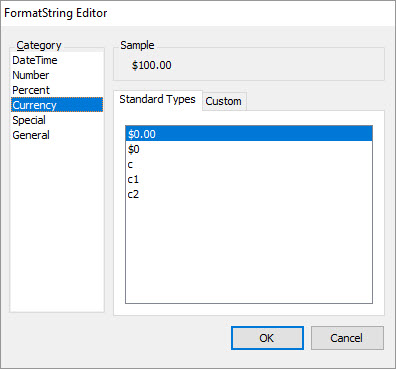
Click OK to close the format editor.

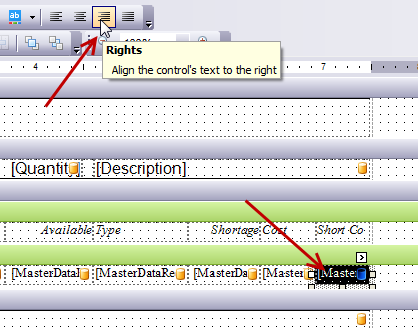
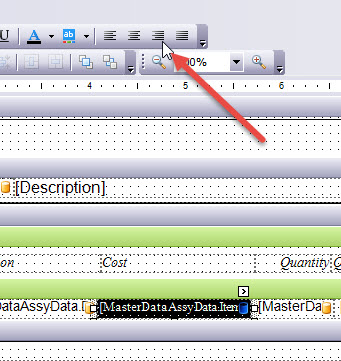
Now, select the Cost column again, and select the Right Justify icon in the toolbar. You might also want to do that to the column header.

Save the report, and print it again.

Extended Cost

Calculating the extended, and total, cost of an assembly is trickier. In this case I’ll use “Cost”, not “Average Cost”, since I have non-inventory items in the BOM that don’t have an average cost value.

I won’t give you the step-by-step process, just some summaries.

In this report I have columns for the level, component item, description, quantity, extended quantity, unit cost and extended cost.

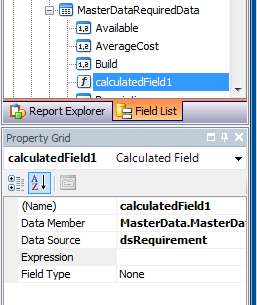
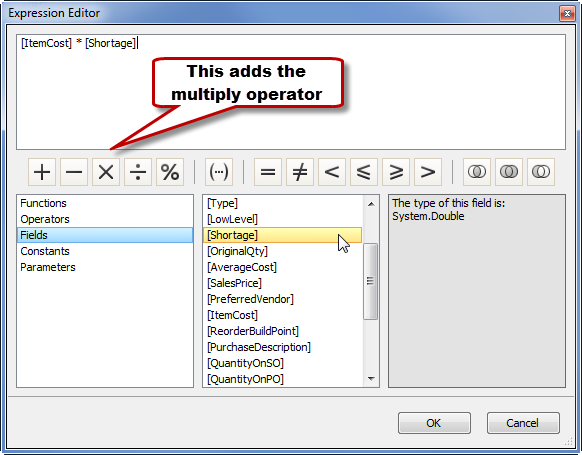
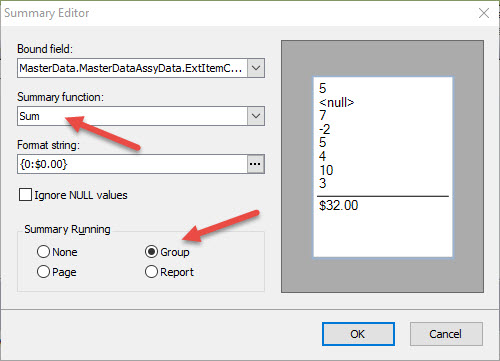
For Extended Cost I will create a “calculated field”. For details on how to add a “calculated field”, see this article, scroll to the section on “creating a calculated field”. Here is the expression that I’ve created:

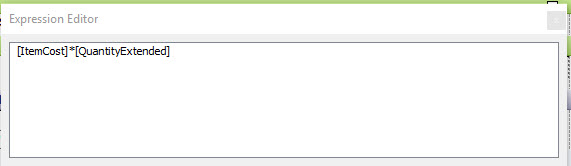
I’ve named this field “ExItemCost”.

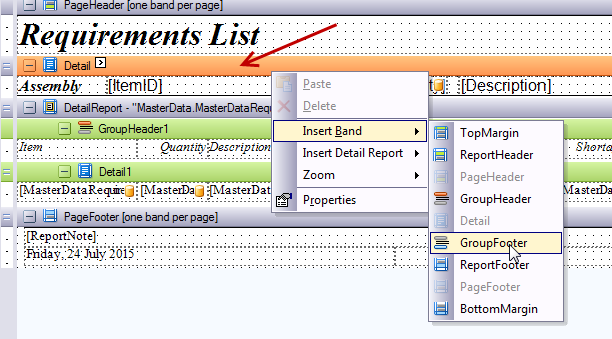
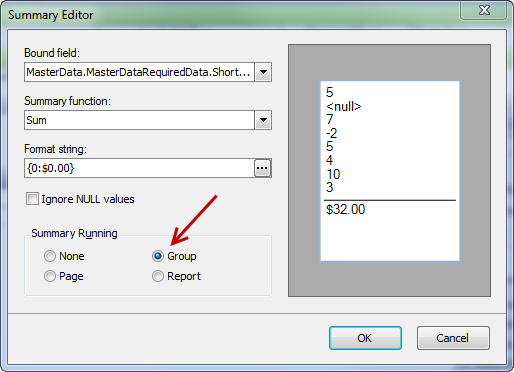
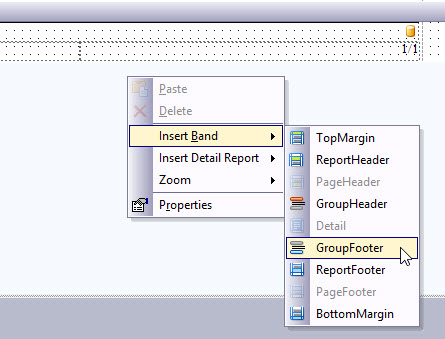
Next, we need to add another band to the report. Right click on a blank area in the report, not on any of the bands. In the popup menu select Insert Band, and then GroupFooter. The name usually defaults to GroupFooter1.

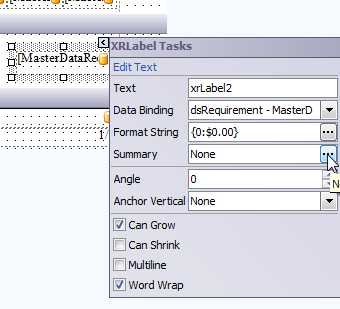
Next, I will add the “ExItemCost” field, found in the MasterDataAssyData section of fields, to the GroupFooter1 band.  Position it under the Ext Cost column, set the format to currency, and set it to align right. In the properties, select Summary and set it to be a “Group” summary.

Save this, then run the report.

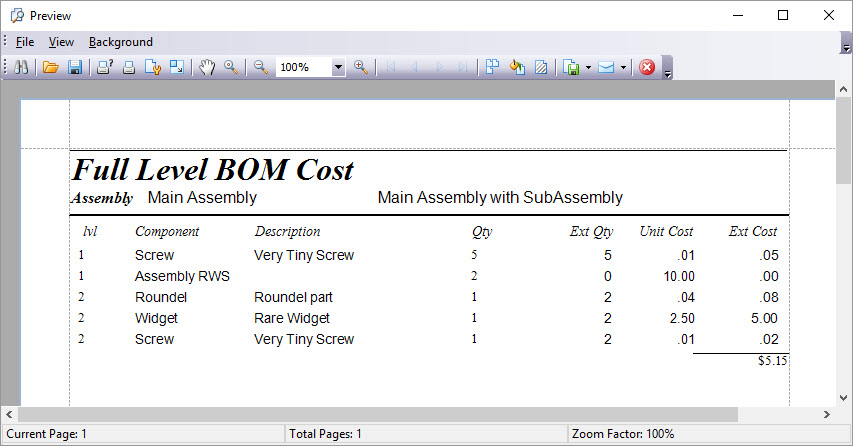
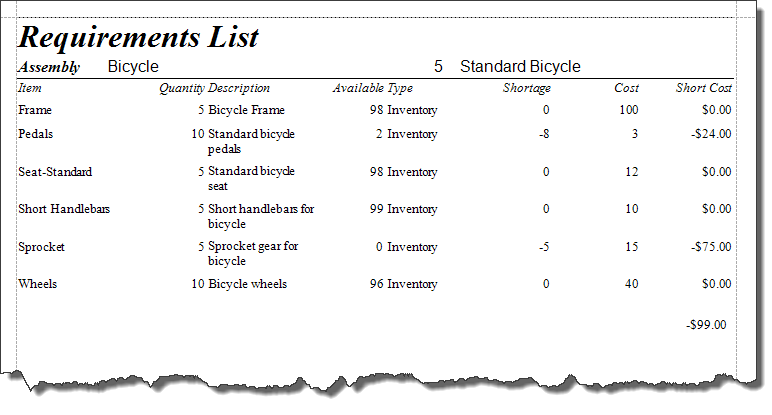
Note that this is a full-level BOM. The “Extended Quantity” for a subassembly item itself, and therefore the “Extended Cost”, is going to be zero. That is because the cost is calculated from the component items.

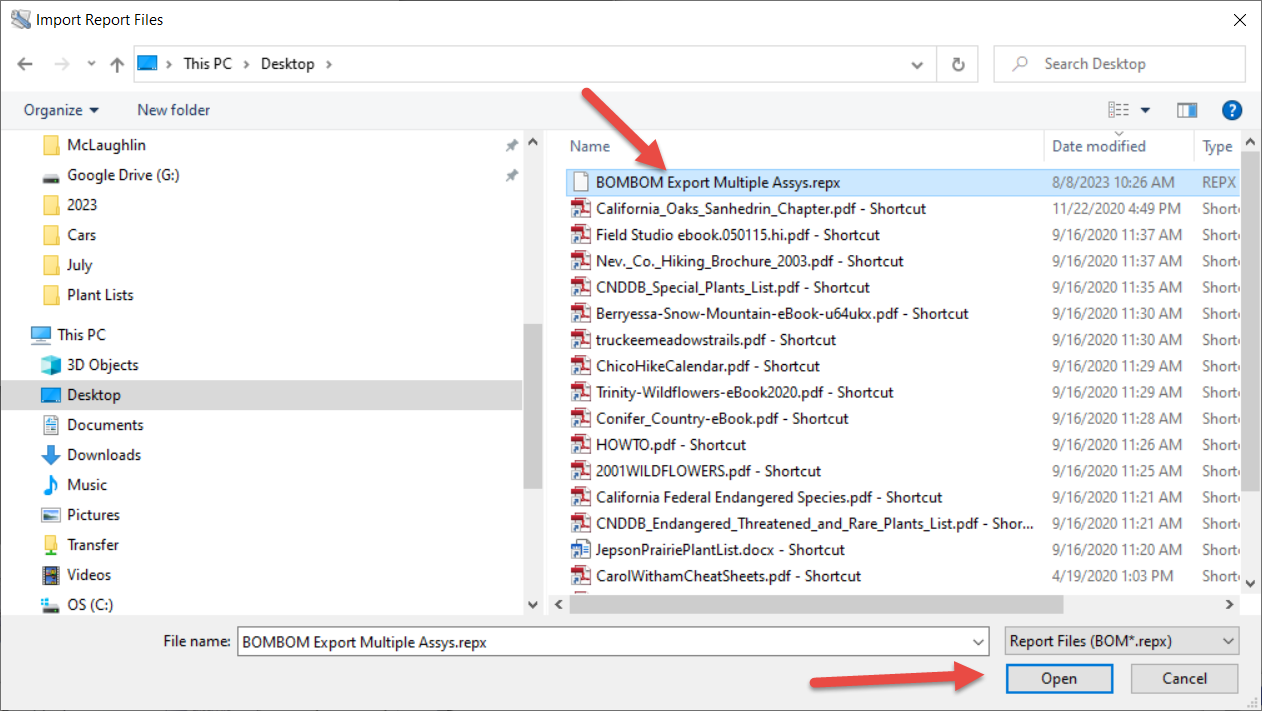
If you would like a copy of this report:

  1. Download the “repx” file from this link (this is a zip file): Costed Full Level
  2. Unzip the file to extract the file BOMCosted Full Level.repx
  3. Run CCRQBOM
  4. Select Forms and then Bill of Material
  5. Click the Import button, and select the repx file from where you saved it.

This will add “Costed Full Level” to your Bill of Materials report menu.

How To Add a Filter to CCRQBOM Reports

There are times when you want to remove certain items from a report in CCRQBOM. To do this you would use a filter, which is easy to add to report definitions. Let’s take a look at a couple of examples.

To start with, I have a very simple assembly item. It consists of two inventory parts and one non-inventory part.

For my first example, I would like to list only the inventory part items in a requirements report that includes this assembly.

Here is a requirements report for a quantity 2 of this assembly.

To edit this report, I will select Forms and then Requirements.

Then I will select the Requirements List report template, and click the Edit button.

In the report editor select Report Explorer and select DetailReport,  since we want to filter the component items in the detail section of the report. Then select the Property Grid. Scroll down to find the Filter String property.

If you click on the right end of the Filter String field an ellipsis (…) will appear, and you will click that to open the FilterString Editor.

Click on the + symbol in the editor, which will add a filter line that you can edit. The filter line has three sections, each in a different color. The blue field is the data field, the green field is the operation, and the gray field is the value. Clicking on each field will allow you to change the filter details. There are several ways that you can manipulate a filter, in our example I want to include every field that is not a non-inventory part.

The data field that I will select from the dropdown list is Type. Note that if you don’t see this data field as an option, you probably haven’t selected the proper section of the report in the Report Explorer. 

The operation that I will select is Does not equal.

The value that I will enter is NonInventory.


Click OK to save the filter. Click File and then Save As to save the report, and give it a unique name. Then close the report editor.

Now when I run the Requirements report, I will select my modified report. As you can see, the Non-inventory part item is not included.

Another example would be to remove a particular part from the report. Let’s say that I want to remove the “Widget” item from the report as shown at the top of this article. I’ll go through all the same steps as above, and create the following filter:

This time I decided to exclude all items that match the condition by changing the red “And” to a “Not And”.

Here’s the report:

The most difficult issue with filters is selecting the proper section of the report. For some reports you will select the overall report, for any report that has a master/detail relation you often will want to select the detail section. If you can’t find the Filter String property then you have selected the wrong section of the report. Note also that not all fields are available in each section of the report.

Adding a Page Break to the BOM Listing

The Mult-Build function of CCRQBOM version 3.2.2 (Assemblies function in version 3.6.0 and later) has an option to print multiple assemblies in one report. The standard report is designed to print the BOM’s in a compressed format, to save paper, by not having page breaks between each assembly. Let’s look at how you can add a page break between assemblies. Note that we’ll be using version 3.2.2 as an example, the process is very similar for version 3.6.0 and later.

Here’s my sample MultiLevel BOM listing (with some very simple data).


To edit this report, select Forms then Bill of Material.

In the Edit Reports window select “Multi Level BOM” and then click the Edit button. Note that the editor may be slow to open, so be patient.

Select the “DetailReport” band by clicking on the band in the editing window, or in the Report Explorer.


In the Property Grid box, scroll down to find the Page Break property (make sure that “DetailReport” is the selected object at the top of the window. Change that property to After the Band.

Select File in the editor menu, then Save As to save this edited report. Give it a unique name. Then close the editor window.

Now when you print the report you should see the new report template that you created in the report list. Here’s the results with my sample data. Each of the BOM’s has a separate page.

Adding Item Pictures to a Bill of Material Report

Here’s a step-by-step outline of how to add pictures of items to a Bill of Materials report with CCRQBOM. I will assume that you have SOME familiarity with editing reports in CCRQBOM.

Although QuickBooks Enterprise has a feature that lets you assign a picture to an inventory item, unfortunately they don’t let you USE that picture in ANY report. They also don’t let add-on developers (like CCRSoftware) access that data. So this is NOT going to be about using that feature in Enterprise.

We are going to assume that you have individual graphic files for each item, and that all of these are stored in one folder on your system.

To start, run CCRQBOM, then select Forms and then Bill of Material.

In the Edit Reports window select your form to work with (“Multi Level BOM” if this is the first time you’ve worked with a form) and click Edit. Note that there may be a delay before the editor opens – it starts up slowly sometimes.

The detail line band (“Detail1”) is where the BOM components are displayed, and this is set up to be an “array”. For this discussion, I want to insert the picture of the component as a column just after the “Description” column. Right-click on that column to get the popup menu, select Insert and then Column To Right.

Next, I want to increase the height of the detail line to allow space for the picture. Unfortunately, this sets aside that much space for each line no matter if there is going to be a picture or not. Select the table in this band, then go to Property Grid, expand the Size property, and change Height to be the size you want (I use 100 here).

Drag a Picture Box from the tool box and drop it on the column that you added to the Detail1 band.


Drag the corners of that picture box so that it fills the space in that column. Once you size it you can change the Anchor Vertically property of the picture box to “Both”, so that it will resize vertically if you change the height of the array later. There isn’t a way to bind the sides, just the top and bottom.

For this discussion, I have a folder in my system that contains the image files that I want to display for each item. These are JPG files, and they have a file name that matches the Item ID in QuickBooks. So, if the BOM says that it needs an item “Lens”, there is a file in this folder named “Lens.jpg”. All of the images are in the same location. In my test I’m using “C:\img”, which isn’t the best choice – you should try a location that is on a shared folder where all users can access it.


With that picture box selected, let’s go to the Property Grid and change several properties:

  • Change Sizing to be Zoom Image.
  • Expand Data Bindings (at the top of the property list), expand Image URL, click Binding and select the ItemID field. You must use the correct one – this will be found by expanding MasterData and then MasterDataAssyData, and selecting ItemID.  The most common error is not selecting the proper binding field, if the report doesn’t show the image.

  • Right under Binding, select Format String and enter this text string:   C:\img\{0}.jpg  The first part is the path to the folder for the images (remember the \ at the end of this), the last part is the file type to add on the end, and the middle is  {0} to represent the place that the ItemID will be inserted. If you happen to open the FormatString Editor for this, select a “General” format, have C:\img\ as the prefix, and .jpg as the suffix


Select File and then Save As, and give this report template a name. I’ll use “BOM WImage” for my example.

Close the editor, then exit Edit Reports.

Now let’s test this. Select BOM and select the assembly. Click the Display button, then in that window click the Print button. A Print Reports window will show, and your new template will be listed there. Click on the template name to select it, then click the Print button to preview the report.

Here’s my report. In this sample, only “Lens” had an image, the others didn’t.


There are other variations, but they are a bit more restricted. For example, if you don’t want to have the images all in one folder, you can put the path in a “custom field” for the item. Note that the path would be limited to 30 characters. You can also use a custom field for the picture name, if you don’t want to use the Item ID as the name.

Why Doesn’t My Report Show All The Info?

When you are working with a CCRQBOM or CCRQInvoice report that has a large amount of information, sometimes you may find that the report doesn’t show all of the detail lines that you expect. This most often occurs when you have created your own report definition in the form editor. Why does this happen, and what can be done about it?

Most people print reports with the “print preview” option, and if you create your own report template there is a preference setting in the report that will limit the number of detail lines that show in the preview. This is the most common reason for a large report not showing all of your information – it is limited to “100 lines” in the preview.

That is an easy issue to fix in your report definition. Edit the report, make sure that you have the “report” selected in the Report Explorer (not one of the subsections). Then in the Property Grid look for the Row Count for Preview property. If this is set to a number (typically 100), you want to change it to zero (which means unlimited), and then save the report. That should fix this problem.

Note that this also means that your print previews can take a long time to display if you have a large report.

Alternately, instead of editing the report, use the Print option instead of Print Preview. This bypasses the limit, and prints the report directly to the printer that you choose.


How To Get The Total Cost of Shortages On A Requirements List

CCRQBOM can generate a requirements list, a report that shows what items you need to purchase if you want to build a required quantity of an assembly. I’ll show you how to add some calculated fields to the report to provide total shortage cost calculation.Here is a requirement list to build a quantity 5 of assembly Bicycle. You can see that there are shortages for two inventory parts.


This uses the standard report template that comes with CCRQBOM.

To modify this template I will select the requirements template from the forms menu.


Select the requirements list option in the edit reports window and click the edit button.


This opens (sometimes after a bit of a delay) the report designer window. Please note that this window may look a bit different with some versions of CCRQBOM, but the elements should all be the same.


Creating a Calculated Field

The first step is to add a calculated field to hold the item cost X shortage value.

In the field list find the MasterDataRequiredData section of MasterData.


Right click on this section to select Add Calculated Field. This adds a calculated field to the field list. In the property grid lower on the screen you should see the properties for this field.


Change the name of the field to ShortCost, then select expression and click the “…” symbol to open the Expression Editor.


In the expression editor select the fields section. Locate ItemCost and double click it to add it to the expression. Double click the “X” symbol to add the multiply operator. Then double click the Shortage field to add that. Click OK to save this expression.


Note that in this case I’m using the ItemCost field, which is “Cost” in QuickBooks. You might want to use AverageCost instead.

Select this ShortCost field for the data binding for the last column, as we illustrated before with the ItemCost field.

Adding Columns

I’ll add two columns, one for ItemCost and one for the calculated shortage cost. I’m not going to make the report pretty, I’m just going to add the columns. You may want to rearrange things or delete unnecessary columns.

Right click on the rightmost column in the Detail1 section, select Insert, and then Column to right. Do this again to add a second column. Repeat this with the headers in GroupHeader1. Then resized the columns to fit what you want.


Double click on each heading column and enter the column names, “Cost” and “Short Cost”.

Change the column headings by double clicking on them and typing in the text you want.

Find ItemCost in the Field List, drag it and drop it on the cell for that column in Detail1. Do the same with ShortCost for the last column.

Select each of the cells and set them to be right justified.


Select each cell, click on the “>” symbol, and set the format string to show currency.


Add the Sum to the Footer

We have a column that shows the calculated cost of the shortage. Now we want to add the sum of this to the report.

First, we want to add a GroupFooter Band to the report, to have a place to hold the sum. This will put the sum at the end of the report for each assembly. (Note: you might add a “ReportFooter” instead of a GroupFooter – that is always at the end of the report. There isn’t much difference between them in most reports, unless you have multiple groups – then you should use a ReportFooter).

Right click on the Detail band, select Insert Band and then GroupFooter.


In the field list, find the ShortCost field and drag it to the GroupFooter.

Position the field to where you want it, resize the GroupFooter as appropriate.

Next, click on the < symbol again, click the ellipsis (…) by Summary.


Select the Group option in Summary Running. Also set the format string to the currency format.


Click OK to close this window, then save your report with the File/Save As menu option and give it a name. Close the editor.

Here is our modified report, showing the unit cost for each item, the shortage cost per item, and a sum of the shortage cost at the bottom.