How To Add a Filter to CCRQBOM Reports

There are times when you want to remove certain items from a report in CCRQBOM. To do this you would use a filter, which is easy to add to report definitions. Let’s take a look at a couple of examples.

To start with, I have a very simple assembly item. It consists of two inventory parts and one non-inventory part.

For my first example, I would like to list only the inventory part items in a requirements report that includes this assembly.

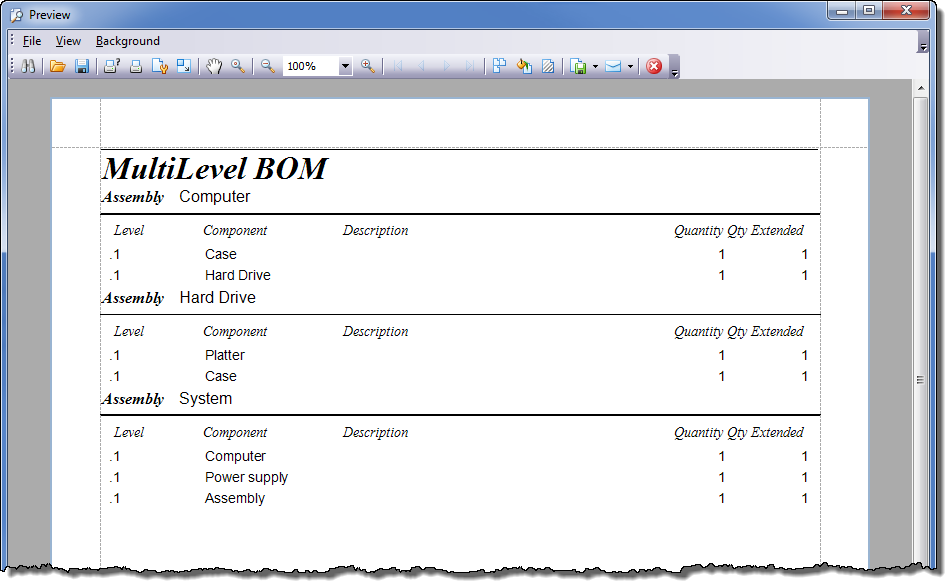
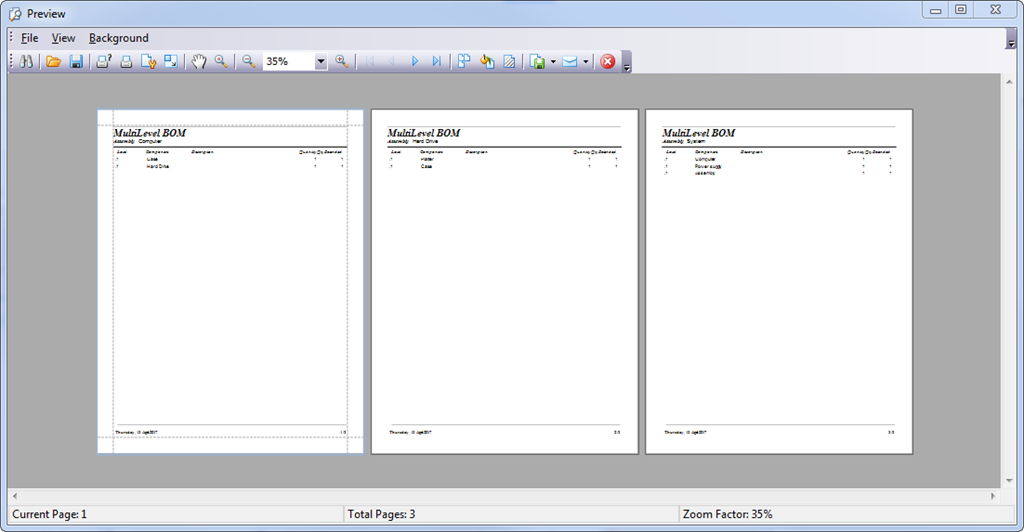
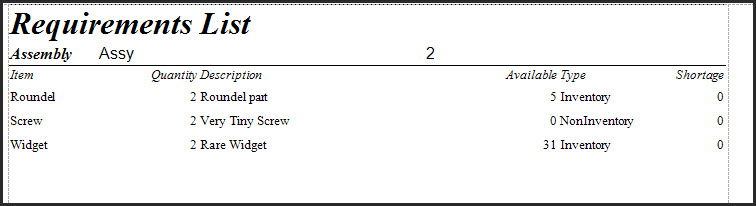
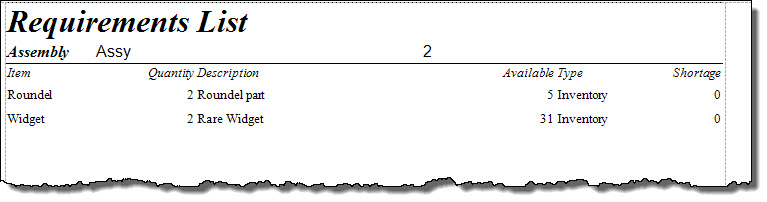
Here is a requirements report for a quantity 2 of this assembly.

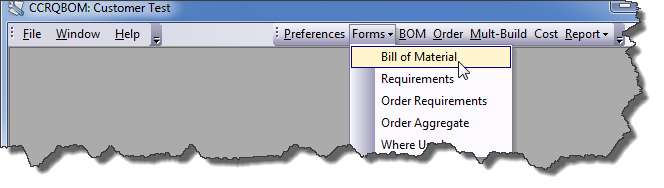
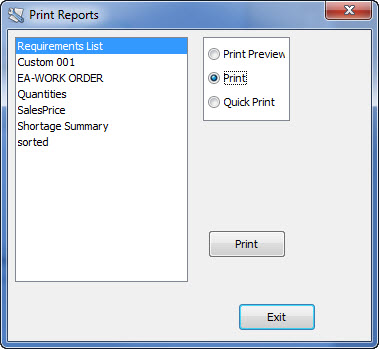
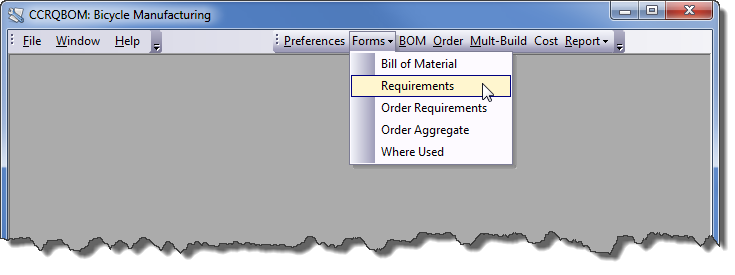
To edit this report, I will select Forms and then Requirements.

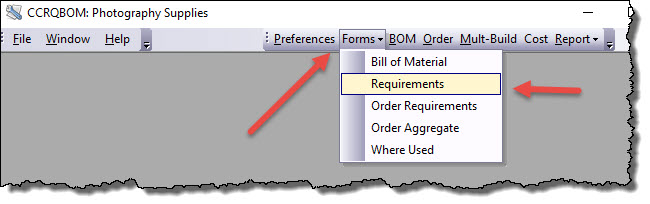
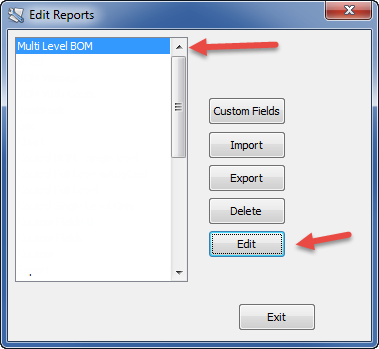
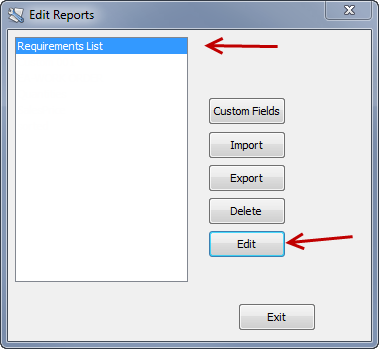
Then I will select the Requirements List report template, and click the Edit button.

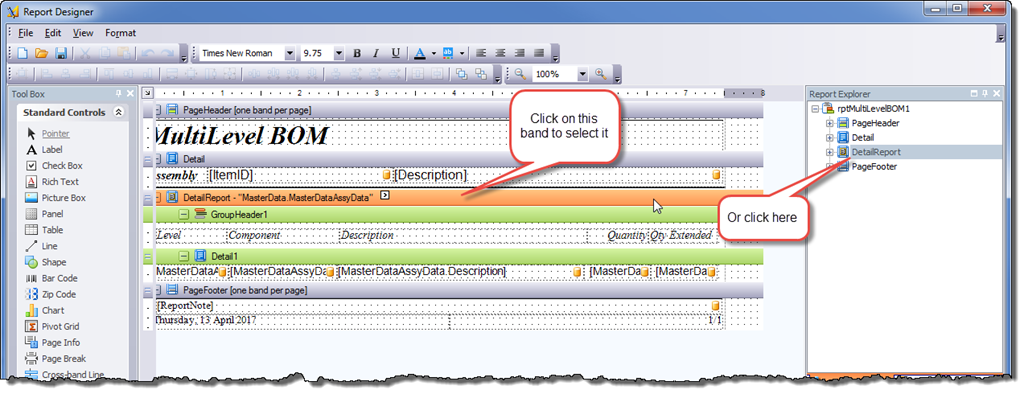
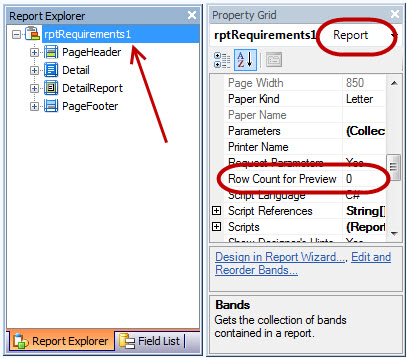
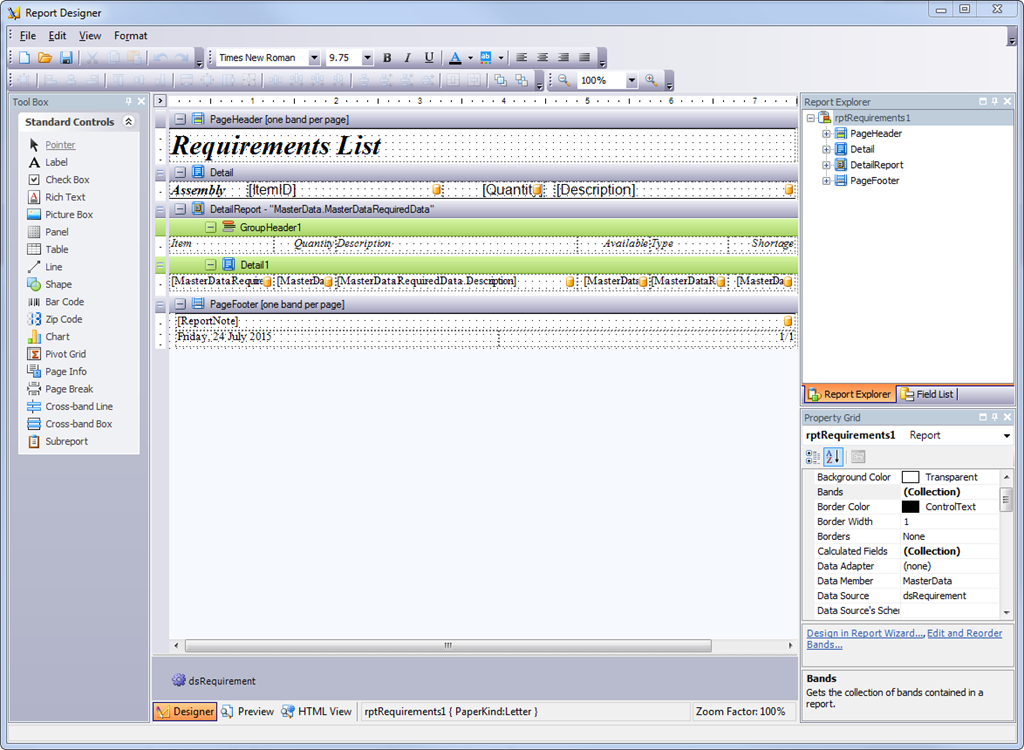
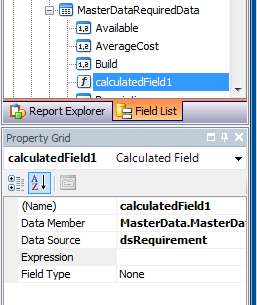
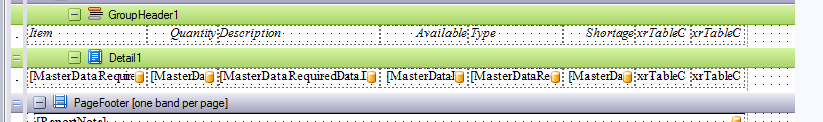
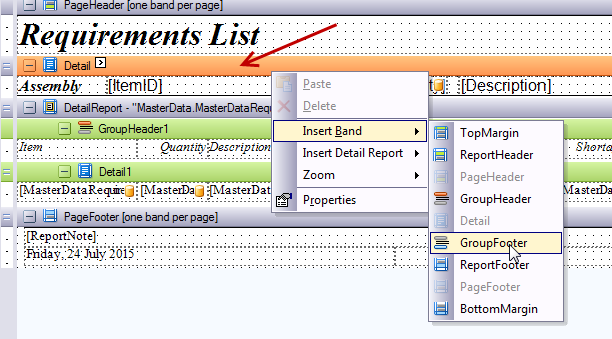
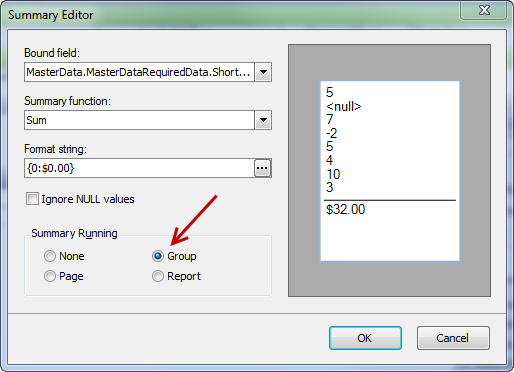
In the report editor select Report Explorer and select DetailReport,  since we want to filter the component items in the detail section of the report. Then select the Property Grid. Scroll down to find the Filter String property.

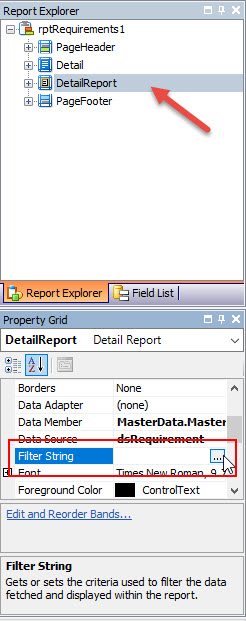
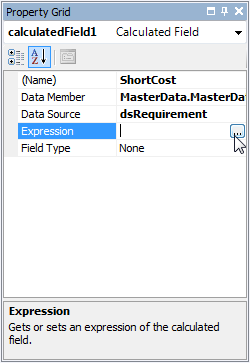
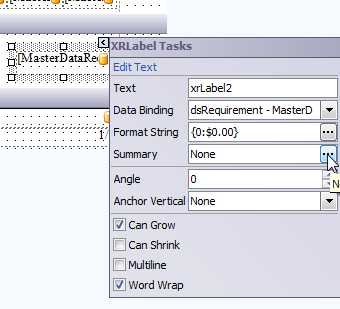
If you click on the right end of the Filter String field an ellipsis (…) will appear, and you will click that to open the FilterString Editor.

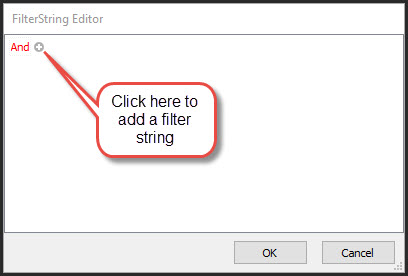
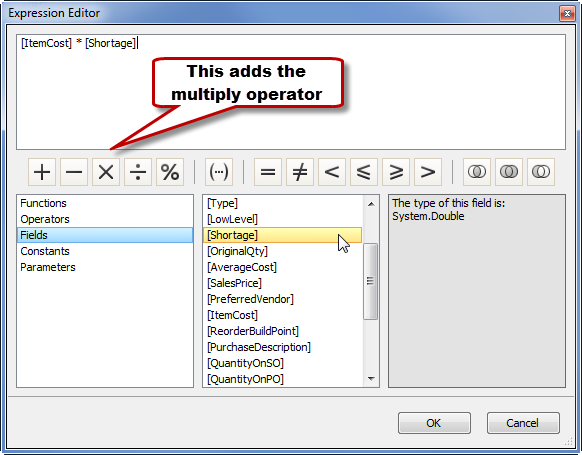
Click on the + symbol in the editor, which will add a filter line that you can edit. The filter line has three sections, each in a different color. The blue field is the data field, the green field is the operation, and the gray field is the value. Clicking on each field will allow you to change the filter details. There are several ways that you can manipulate a filter, in our example I want to include every field that is not a non-inventory part.

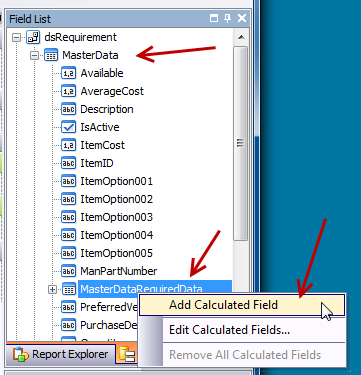
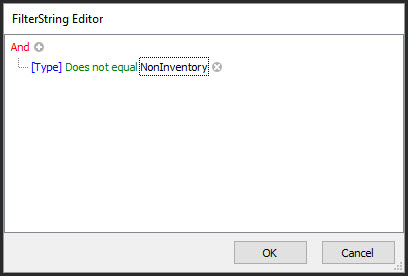
The data field that I will select from the dropdown list is Type. Note that if you don’t see this data field as an option, you probably haven’t selected the proper section of the report in the Report Explorer. 

The operation that I will select is Does not equal.

The value that I will enter is NonInventory.


Click OK to save the filter. Click File and then Save As to save the report, and give it a unique name. Then close the report editor.

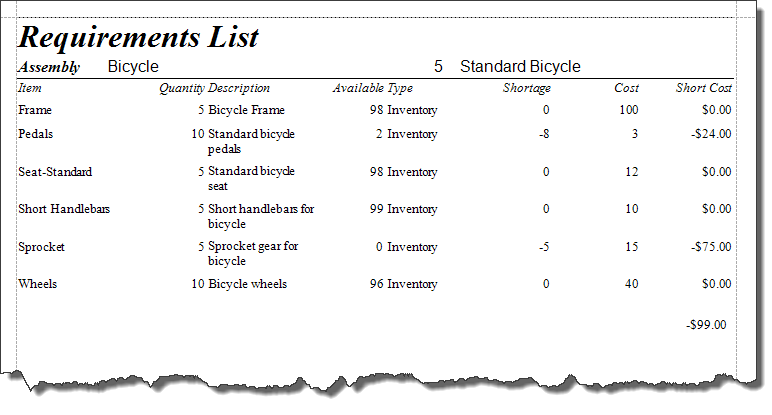
Now when I run the Requirements report, I will select my modified report. As you can see, the Non-inventory part item is not included.

Another example would be to remove a particular part from the report. Let’s say that I want to remove the “Widget” item from the report as shown at the top of this article. I’ll go through all the same steps as above, and create the following filter:

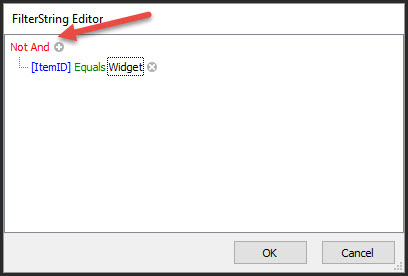
This time I decided to exclude all items that match the condition by changing the red “And” to a “Not And”.
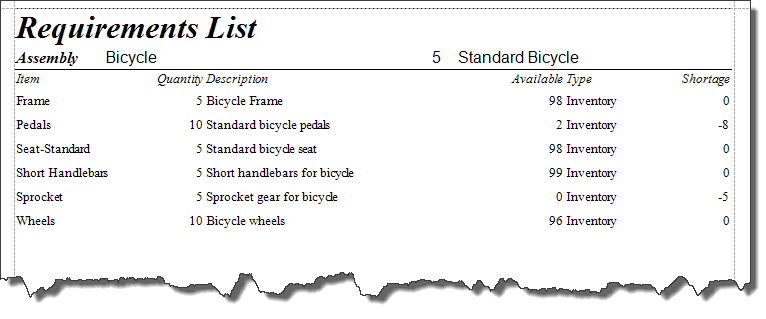
Here’s the report:

The most difficult issue with filters is selecting the proper section of the report. For some reports you will select the overall report, for any report that has a master/detail relation you often will want to select the detail section. If you can’t find the Filter String property then you have selected the wrong section of the report. Note also that not all fields are available in each section of the report.

Adding a Page Break to the BOM Listing

The Mult-Build function of CCRQBOM version 3.2.2 (Assemblies function in version 3.6.0 and later) has an option to print multiple assemblies in one report. The standard report is designed to print the BOM’s in a compressed format, to save paper, by not having page breaks between each assembly. Let’s look at how you can add a page break between assemblies. Note that we’ll be using version 3.2.2 as an example, the process is very similar for version 3.6.0 and later.

Here’s my sample MultiLevel BOM listing (with some very simple data).


To edit this report, select Forms then Bill of Material.

In the Edit Reports window select “Multi Level BOM” and then click the Edit button. Note that the editor may be slow to open, so be patient.

Select the “DetailReport” band by clicking on the band in the editing window, or in the Report Explorer.


In the Property Grid box, scroll down to find the Page Break property (make sure that “DetailReport” is the selected object at the top of the window. Change that property to After the Band.

Select File in the editor menu, then Save As to save this edited report. Give it a unique name. Then close the editor window.

Now when you print the report you should see the new report template that you created in the report list. Here’s the results with my sample data. Each of the BOM’s has a separate page.

Why Doesn’t My Report Show All The Info?

When you are working with a CCRQBOM or CCRQInvoice report that has a large amount of information, sometimes you may find that the report doesn’t show all of the detail lines that you expect. This most often occurs when you have created your own report definition in the form editor. Why does this happen, and what can be done about it?

Most people print reports with the “print preview” option, and if you create your own report template there is a preference setting in the report that will limit the number of detail lines that show in the preview. This is the most common reason for a large report not showing all of your information – it is limited to “100 lines” in the preview.

That is an easy issue to fix in your report definition. Edit the report, make sure that you have the “report” selected in the Report Explorer (not one of the subsections). Then in the Property Grid look for the Row Count for Preview property. If this is set to a number (typically 100), you want to change it to zero (which means unlimited), and then save the report. That should fix this problem.

Note that this also means that your print previews can take a long time to display if you have a large report.

Alternately, instead of editing the report, use the Print option instead of Print Preview. This bypasses the limit, and prints the report directly to the printer that you choose.


How To Get The Total Cost of Shortages On A Requirements List

CCRQBOM can generate a requirements list, a report that shows what items you need to purchase if you want to build a required quantity of an assembly. I’ll show you how to add some calculated fields to the report to provide total shortage cost calculation.Here is a requirement list to build a quantity 5 of assembly Bicycle. You can see that there are shortages for two inventory parts.


This uses the standard report template that comes with CCRQBOM.

To modify this template I will select the requirements template from the forms menu.


Select the requirements list option in the edit reports window and click the edit button.


This opens (sometimes after a bit of a delay) the report designer window. Please note that this window may look a bit different with some versions of CCRQBOM, but the elements should all be the same.


Creating a Calculated Field

The first step is to add a calculated field to hold the item cost X shortage value.

In the field list find the MasterDataRequiredData section of MasterData.


Right click on this section to select Add Calculated Field. This adds a calculated field to the field list. In the property grid lower on the screen you should see the properties for this field.


Change the name of the field to ShortCost, then select expression and click the “…” symbol to open the Expression Editor.


In the expression editor select the fields section. Locate ItemCost and double click it to add it to the expression. Double click the “X” symbol to add the multiply operator. Then double click the Shortage field to add that. Click OK to save this expression.


Note that in this case I’m using the ItemCost field, which is “Cost” in QuickBooks. You might want to use AverageCost instead.

Select this ShortCost field for the data binding for the last column, as we illustrated before with the ItemCost field.

Adding Columns

I’ll add two columns, one for ItemCost and one for the calculated shortage cost. I’m not going to make the report pretty, I’m just going to add the columns. You may want to rearrange things or delete unnecessary columns.

Right click on the rightmost column in the Detail1 section, select Insert, and then Column to right. Do this again to add a second column. Repeat this with the headers in GroupHeader1. Then resized the columns to fit what you want.


Double click on each heading column and enter the column names, “Cost” and “Short Cost”.

Change the column headings by double clicking on them and typing in the text you want.

Find ItemCost in the Field List, drag it and drop it on the cell for that column in Detail1. Do the same with ShortCost for the last column.

Select each of the cells and set them to be right justified.


Select each cell, click on the “>” symbol, and set the format string to show currency.


Add the Sum to the Footer

We have a column that shows the calculated cost of the shortage. Now we want to add the sum of this to the report.

First, we want to add a GroupFooter Band to the report, to have a place to hold the sum. This will put the sum at the end of the report for each assembly. (Note: you might add a “ReportFooter” instead of a GroupFooter – that is always at the end of the report. There isn’t much difference between them in most reports, unless you have multiple groups – then you should use a ReportFooter).

Right click on the Detail band, select Insert Band and then GroupFooter.


In the field list, find the ShortCost field and drag it to the GroupFooter.

Position the field to where you want it, resize the GroupFooter as appropriate.

Next, click on the < symbol again, click the ellipsis (…) by Summary.


Select the Group option in Summary Running. Also set the format string to the currency format.


Click OK to close this window, then save your report with the File/Save As menu option and give it a name. Close the editor.

Here is our modified report, showing the unit cost for each item, the shortage cost per item, and a sum of the shortage cost at the bottom.